A simple real-time Open Interest & Strategy Profit and Loss Visualizer for Indian Benchmark Indices and F&O Stocks inspired by Sensibull. The app is built with React, Material UI, D3 and Node.
The NSE OI Visualizer & Strategy-Builder is an innovative React application designed for trading enthusiasts who want to visualize real-time Open Interest data alongside Option Strategy Profit and Loss for Indian Benchmark Indices and F&O stocks. By leveraging data from the NSE API, this application provides insightful visualizations such as OI bar plots and Strategy Payoff line plots, ensuring that users have access to crucial trading information at their fingertips. With data refreshing every three minutes, traders can stay updated with minimal delay, offering an advantage in fast-moving market conditions.
Built with a robust combination of popular web technologies including React, Material UI, Redux, and D3 for the frontend, and NodeJS for the backend, the app is currently a work in progress. As such, ongoing enhancements aim to improve user experience and expand functionality, making it a tool worth watching.
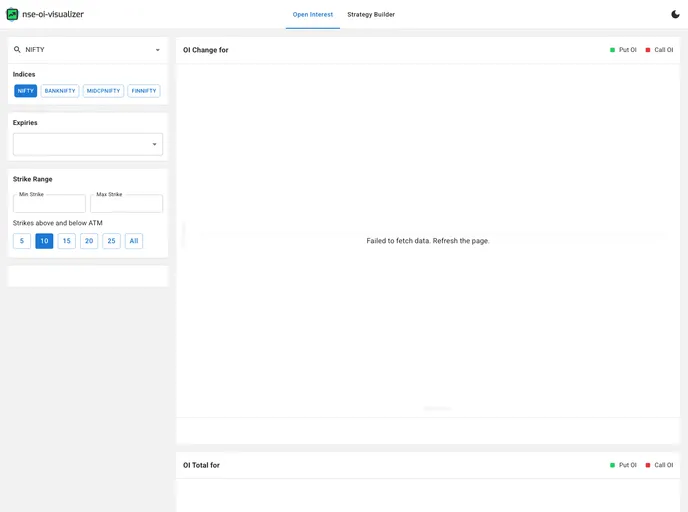
Real-time Open Interest Data: Displays up-to-the-minute Open Interest information for major indices (NIFTY, BANKNIFTY, FINNIFTY, and MIDCPNIFTY) and 185 listed F&O stocks.
Change in Open Interest Visualization: Provides users with a clear view of the change in Open Interest alongside total Open Interest, assisting in decision-making.
Multi-expiry Selector: Users can select from various expiry dates—offering insights based on 2 weekly and 2 monthly expiries for indices and 2 monthly expiries for stocks.
Strike Range Selector: Customize the displayed strike prices, adjusting the number of strikes to analyze, which caters to multiple trading strategies.
Option Strategy Payoff Calculation: This feature allows users to calculate potential profits or losses at specific target dates as well as the expiry date for the selected underlying, accommodating up to 10 legs.
Implied Volatility Calculation: Utilizes the Black-76 model to calculate Implied Volatility (IV) for each strike, providing insights into option pricing.
Auto-Updating Data: With precision, the app auto-updates its data every three minutes using a web worker, ensuring that users have the latest information when they need it.
Local Storage Persistence: Saves the selected underlying data in local storage, enabling users to maintain their preferences across sessions easily.