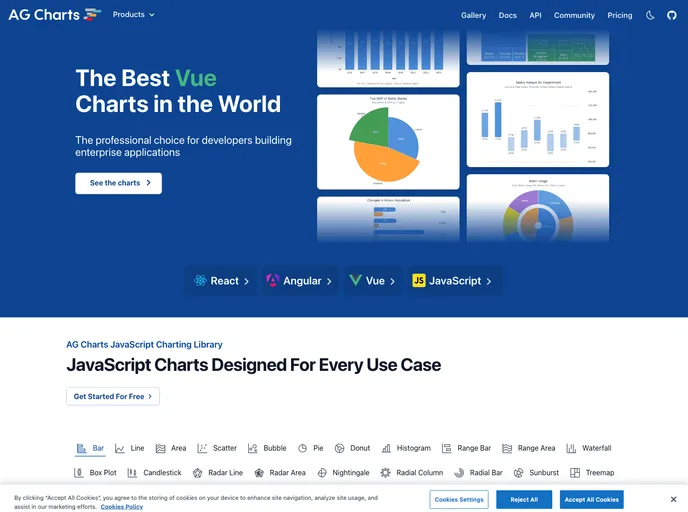
AG Charts is a fully-featured and highly customizable JavaScript charting library. The professional choice for developers building enterprise applications
Overview
Ag Charts is a powerful JavaScript charting library designed with developers in mind. It offers a rich set of features that cater to the needs of enterprise applications, ensuring high customization and flexibility. With its professional capabilities, Ag Charts empowers developers to create interactive and visually appealing charts that can enhance data presentation and analysis.
Features
- Fully Customizable: Tailor charts to meet specific needs with flexible styling options and configurations, ensuring that each visualization aligns with your project’s requirements.
- Interactive Components: Enhance user experience with interactive features such as tooltips, zooming, and panning which allow for deeper data exploration.
- Comprehensive Chart Types: Choose from a wide range of chart types, including line, bar, scatter, and pie charts, to effectively present different kinds of data.
- Integration Ready: Easily integrates with popular frameworks and libraries, making it a seamless addition to existing applications.
- Performance Optimized: Built for high performance, even when handling large datasets, ensuring fast rendering and smooth interactions.
- Rich API: Leverage an extensive API that provides developers with full control over chart behavior and visual appearance.
- Mobile Friendly: Designed to function well on both desktop and mobile devices, ensuring data is accessible wherever users are.